وضاحت
Creating charts has never been easier. Heck, you’d almost call it fun.
This plugin allows the user to create and insert a Google Chart in just a few short clicks. Check out the working online demo to see for yourself.
تصوير
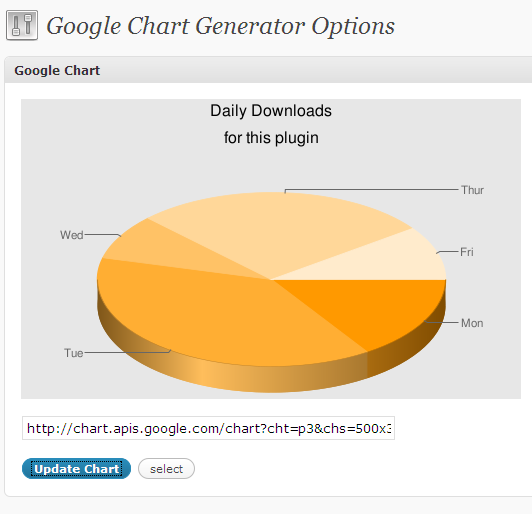
The top of the options page shows you a sample graph. 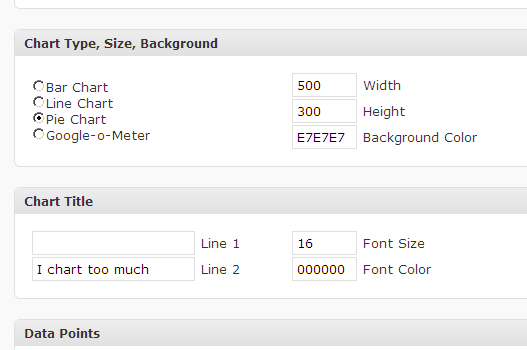
Insert the data you'd like to graph... 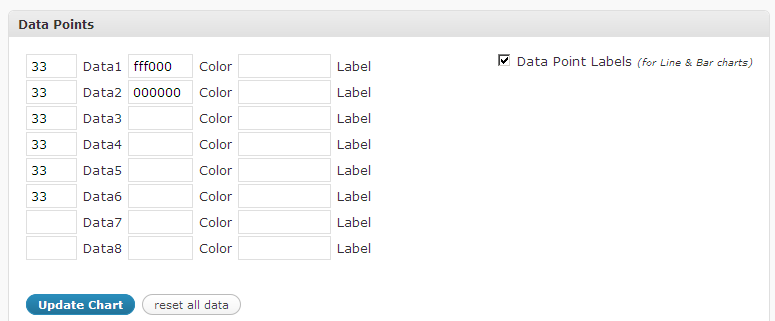
You can now insert data labels, axis labels, etc. 🙂 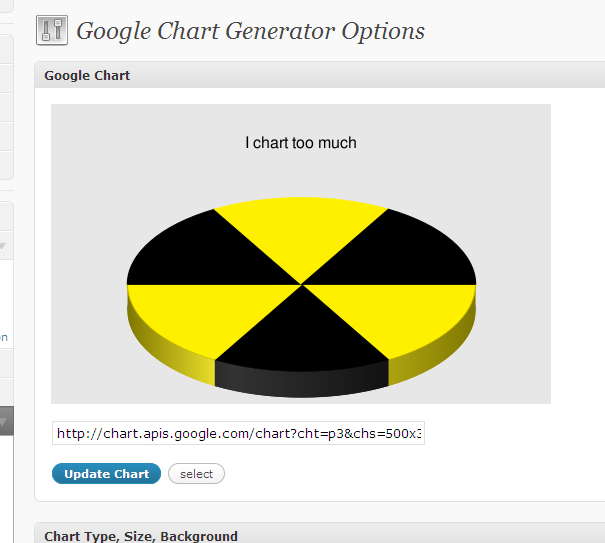
Having fun with the charts
انسٽاليشن
- Upload the
google-chart-generatorfolder to the/wp-content/plugins/directory - Activate the plugin through the ‘Plugins’ menu in WordPress
- Look under “Settings” –> “Google Chart Generator” to create a chart.
- Copy and paste the code generated wherever you like (posts, pages, sidebar, text widget, etc).
FAQ
- Do I need to know anything about the Google Chart API to use this?
-
No! 🙂
- Do I need to register with Google and create something like a Deveoplor API Key or something else I don’t understand?
-
No! 🙂
- Is this easy enough that I can use it?
-
Yes! 🙂
- What do I do after installing it?
-
Simply click the buttons and create the chart you like. Version 1.0.3 allows you to insert titles, labels, and customize the colors to your liking. After you get the chart looking the way you want it, select the link, copy, and paste into a widget, post, page, e-mail, etc.
جائزا
ھن پلگ ان لاءِ ڪي به رايا ناھن.
تعاون ڪندڙ & ڊولپرز
“Google Chart Generator” اوپن سورس سافٽ ويئر آهي. ھيٺين ماڻھن ھن پلگ ان ۾ حصو ورتو آھي.
تعاون ڪندڙترجمو ڪريو “Google Chart Generator” توهان جي ٻولي ۾.
ڊولپمينٽ ۾ دلچسپي؟
ڪوڊ براؤز ڪريو، چيڪ ڪريو SVN مخزن، يا رڪنيت حاصل ڪريو ڊولپمينٽ لاگ پاران RSS.
لاگ تبدیل ڪريو
Planned Features:
- Dynamically updated charts are getting closer. You’ll be able to create charts for things like “Today’s Visitors were from these continents”. Pretty dang shlick.
- Add button on the write post screen. (for write/edit and posts/pages)
- Save charts to a table so that you can insert “favorite charts”
- Create “Chart Groups” so that you can easily change the appearance of charts across your site.
- Version 1.0.4: Added Data Point Labels and Axis Labels for Line & Bar Charts.
- Version 1.0.3: Added chart title, background color, labels, data color. IE does not look good. I promise I’ll work on that. Try Firefox for best results.
- Version 1.0.2: General scrambling associated with an unplanned beta release.
- Version 1.0.1: I accidentally release this to the public before it was ready, so I decided to go ahead and release what I have now. I’m actively developing this, so please leave feedback.
- Version 1.0: Very basic version. My goal is to get this thing off the ground as soon as possible.